If you haven’t already done so, you should first see the descriptions of the monthly and quarterly standard reports currently available and the fields of information included in the reports by reviewing The PBR1000 page. Click here to go there.
For an example download The PBR1000 May 2018 Snapshots by clicking here.
Here are some descriptions and sample looks at The PBR1000 Monthly Snapshots.
The PBR1000 Monthly Snapshot Workbook is in an MS EXCEL workbook. The reports are accessible by clicking on the tabs at the bottom of the worksheet you are on. Currently there are 15 The PBR1000 Monthly Snapshot Reports.
Following are some extracts and subsets of some of the reports generated during a month.
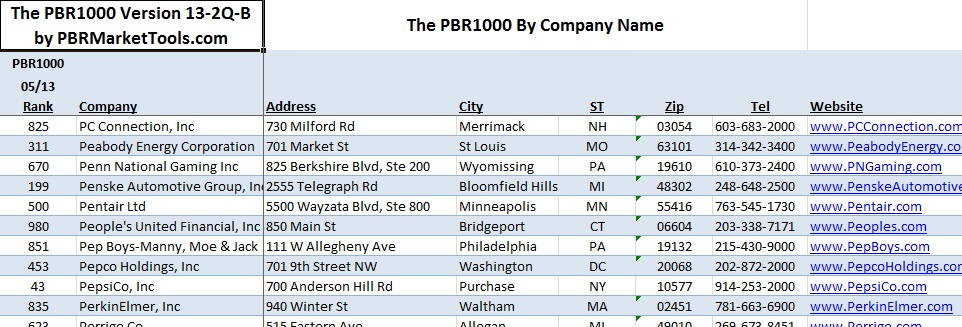
Report 01: By Company Name. This is a list in alphabetical order by Company Name. This report contains all fields of information(See The PBR1000 page for more details on fields included.). At the bottom are the totals of all the financial fields. Here’s an example of a subset of Report 1:
Report 02: By Revenues. This report is by Fiscal Year 2012 Revenues in descending order and includes all data fields. Totals are at the bottom. Here’s a subset of Report 2 showing the revenue fields:

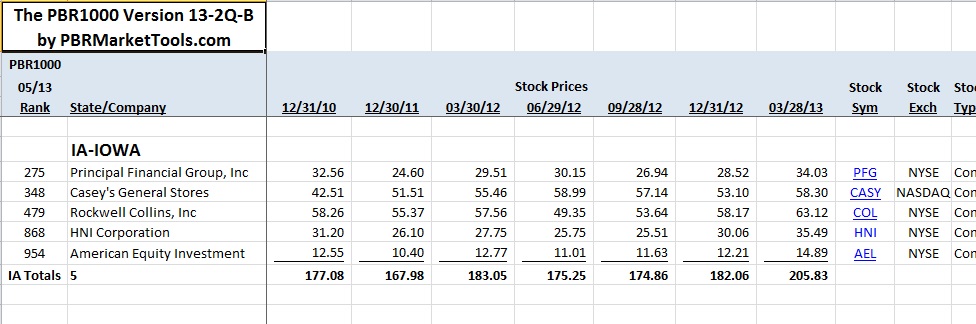
Quarterly Report: By State. This report is generated at least quarterly and is sorted by the 2 letter official post office abbreviation for a state, and then a secondary sort by revenues descending. All data fields are included. Financial and stock data are totaled by state. Here’s a subset of a state report showing Stock Prices and the Stock Symbol hotlink to get the latest Stock Price for The PBR1000 companies in Iowa:
Quarterly Report: By SIC. This report is generated at least quarterly and is sorted by SIC code. The SIC code for a company is based on its disclosure to the SEC and then reported in the EDGAR system. Common SIC codes are then grouped together and financial and stock data are then totaled by that SIC grouping. Fields included are city and state, SIC, rankings, financial and stock data. Here’s a subset of a sample SIC report for some construction related SICs showing annual revenues, profits, and number of employees in 2012:

Of course, you are not limited to these reports. With a basic knowledge of Microsoft EXCEL you can easily create additional reports customized for even more types of analysis and tracking. You can add fields of information, data on other companies, do different sorts and calculations, and much more. Need some help doing this? Just contact us!
To get The PBR1000 Monthly Snapshots and the associated reports and informative blog posts, just go to the SUBSCRIBE page.