The PBR1000 Monthly Snapshots, and the supplemental analytical reports generated during the month, are handy quick references in Microsoft EXCEL format of key business data from over 1,000 of the largest US publicly traded companies, companies with revenues ranging from over $1 billion to nearly $600 billion in their latest fiscal year.
The PBR1000 companies with fiscal years ending in 2020 generated nearly $15 trillion in worldwide revenues and employed nearly 37 million people. That’s more revenue than is generated by all US commercially located enterprises and US home based businesses combined! Needless to say, The PBR1000 companies are key drivers of the US and world economies.
The PBR1000 Monthly Snapshots are an invaluable resource for stock market investors/advisers, business and government professionals, educators, job seekers, and interested citizens because it provides current and accurate important demographic, financial, and industry data, for a very affordable investment, that will save significant research time, money and duplicate efforts. To make the highest probability-of-success decisions it is important that you understand as best as possible the trends and opportunities of these companies and the markets they serve.
The PBR1000 Monthly Snapshots include:
- Report 01: The PBR1000 By Company Name. An alphabetical list by Company Name
- Report 02: The PBR1000 By FYE 2020 and 2021 Revenues, in descending order from the latest annual 10-K reports filed with the SEC.
- Report 03: The PBR1000 By % Change in Revenues, descending. Latest FY Revenues divided by the previous FY Revenues.
- Report 04: The PBR1000 By % of Profits to Revenues for the latest FY, descending.
- Report 05: The PBR1000 By Earnings Per Share, descending.
- Report 06: The PBR1000 By Assets, descending.
- Report 07: The PBR1000 By % of Equity to Assets, descending.
- Report 08: The PBR1000 By Dividends, descending.
- Report 09: The PBR1000 By Number of Employees, descending.
- Report 10: The PBR1000 By Stock Price, descending.
- Report 11: The PBR1000 By Stock Price % Change from the previous month, descending.
- Report 12: The PBR1000 By Stock Price % Change Year to Date, descending.
- Report 13: The PBR1000 By Stock Price % Change to 12/31/15, descending.
- Report 14: The PBR1000 By P/E Ratio, descending.
- Report 15: The PBR1000 By Market Capitalization, descending.
- Stocks/Commodities Report: This is included at the bottom of each of the monthly reports above and includes:
- DJIA, NASDAQ Composite, and S&P 500 closing prices for year ending 2011, quarterly for 2012 through 2015, and for all months for 2016 through 2021.
- Gold and Silver prices for year 2011, quarterly for 2012 through 2015, and for all months for 2016 through 2021.
- Crude Oil prices for year 2011, quarterly for 2012 through 2015, and for all months for 2016 through 2021.
- Quarterly Report By Industry: By primary SIC codes, with subtotals by major SIC code groups
- Quarterly Report By State: Alphabetical by State by latest fiscal year revenues descending.
- Supplementary Reports throughout the year, such as our popular CEO Reports.
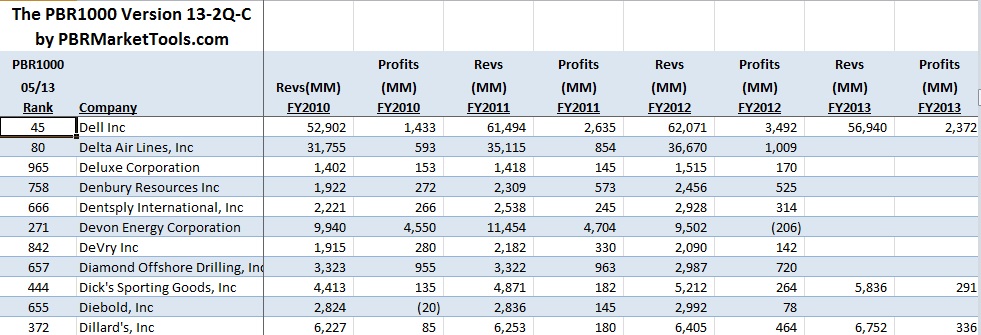
Here’s a Sample Report that shows a subset of Report 01, the alpha list. Please note that there are many more columns of key information that is available in the report:
The PBR1000 Monthly Snapshots currently contains the following key demographic and financial data in most of the reports:
- The Current Quarter PBR1000 Rank
- The Number of Comments in the Comments Field
- Company Address information(Name, Street, City, State, Zip)
- Telephone
- Website hotlink
- SIC Code and Description
- The Fortune 500/1000 rank for June, 2015
- Fiscal Year Ending Month
- Revenues and Profits for Fiscal Years starting in 2013
- % Change in Revenues for most recent fiscal year and previous fiscal year
- Ranking by % Change in Revenues
- % of Profits to Revenues
- Ranking by % of Profits to Revenues
- Earnings Per Share-Basic for Fiscal Years ending from 2013 to 2017
- Ranking by Earnings Per Share-Basic
- Total Assets for Fiscal Years ending in 2015 through 2021
- Stockholders Equity for Fiscal Years ending in from 2015 to 2021
- Ranking by Total Assets
- % of Stockholders Equity to Total Assets
- Ranking by % of Stockholders Equity to Total Assets
- Stock Dividends, based on payout date, for Fiscal Years ending from 2012 to 2021
- Ranking by most recent fiscal year Stock Dividends
- Number of Employees for 2012 through 2021, full time & part time)
- Ranking by Number of Employees
- Last Fiscal Year 10-K Hotlink
- Year end stock prices
- Quarterly stock prices for 12/31/12 through 2014, monthly for 2015 through 2021
- Stock Price for the most recent month
- Ranking for the most recent month Stock Price
- Stock Price % Change from Previous Month
- Ranking by Stock Price % Monthly Change
- Stock Price % Change Last 12 Months
- Ranking by Stock Price % Change Last 12 Months
- Stock Price % Change Last 24 Months
- Ranking by Stock Price % Change Last 24 Months
- Stock Price % Change Last 60 Months
- Ranking by Stock Price % Change Last 60 Months
- P/E Ratio for the most current month, stock price over the most recently available fiscal year earnings per share
- Ranking by P/E Ratio
- Market Capitalization for the latest month and year
- Ranking by Market Capitalization for the latest month
- Stock Symbol and hotlink for current stock price
- Stock Exchange
- Stock Type
- Company hotlinks to the current Board of Directors and Executive Management(Note: A few do not have links.)
- Current CEO and hotlink to a brief biography
- CEO Gender
- CEO Titles
- CEO Board Member Year
- Current CEO Appointment Year and Month
- A Comments Field with news headlines and a hotlink to the source document
As a subscriber to The PBR1000 Monthly Snapshots you also receive additional supplemental analytical reports, our 2-4 times a month blog, important news updates, special offers, and notifications of Q&A events and webinars. We have some fun contests as well. You may unsubscribe at any time and your personal data is secure and not made available to anyone else.
All The PBR1000 Data and Monthly Snapshots are for single use only. This means that it is for the use by the purchaser or the person designated by the purchaser only.
Multiple Use, Unlimited Use, .csv versions, and customized versions of The PBR1000 Monthly Snapshots are also available. Please contact PBRMarketTools by emailing Info@PBRMarketTools.com for more details and a quote.
NOTE: PBRMarketTools has compiled this information from a wide variety of publicly available company, governmental, and business sources and therefore is not responsible or liable for the content. The sources for most of The PBR1000 Monthly Snapshots data are included on the Links page.
The PBR1000 Monthly Snapshots are an important investment for the serious business professional. For an annual subscription just go to the SUBSCRIBE page. After the purchase is completed you will then be directed to the download page to get the current month report. It’s easy and takes only a few minutes for the whole process.
(FREE BONUS! Currently The PBR25 Top Buy Stocks and The PBR US Indices Snapshots are provided as a free bonus with your annual subscription to The PBR1000. For more information, or to order a standalone subscriptions, please go to The PBR25 Top Buy Stocks Information Page and The PBR US Indices Information Page.