The Week 18 of 2022 US Stock Market News Recap

The Week 18 of 2022 US Stock Market News Recap

Stock Market Bull Bear Stocks Investing Investor ThePBR1000 ThePBR25

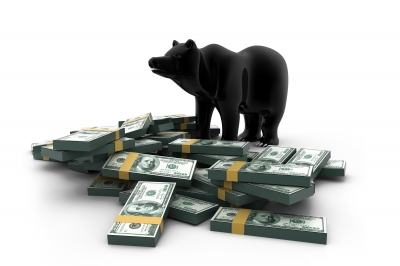
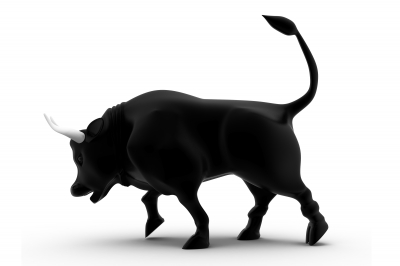
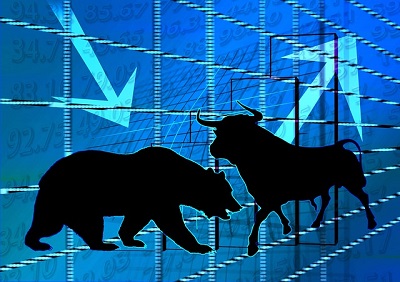
Week 18: For the third week in a row The Stock Market Bull has the lead on Thursday, then The Stock Market Bear crushes him on Friday to get the win.

By Larry C. Paxton

The US Stock Market Week 18 Summary:

In Week 18 The Stock Market Bull, anxious to get back into the win column, had a very nice Monday, followed by an okay Tuesday. On Wednesday, after the press conference with Federal Reserve Chairman Jerome Powell, investors had a collective sigh of relief and The Stock Market Bull took a huge leap up. But Thursday it became a little bit like buyer’s remorse. The Stock Market Bear charged into the pasture and almost wiped out all of the weekly gains. Like a matador, on Friday all The Stock Market Bear had to do was put his big paw on The Stock Market Bull‘s nose and sure enough, he toppled over bloodied, exhausted, and near death. For the third week in a row The Stock Market Bear comes from behind on Friday to take the week. With his Week 18 win The Stock Market Bear also becomes a five weeks in a row outright victor. Can The Stock Market Bull be revived?


US Stock Market Indices Summary

Week 18  of 2022 Ending 05/06/22

DJIA NASDAQ S&P500
Previous Year Close(12/31/21) 36,338.30 15,644.97 4,766.18
Previous Quarter Close(03/31/22) 34,678.35 14,220.52 4,530.41
Previous Month Close(04/29/22) 32,977.21 12,334.64 4,131.93
Record Close Date 01/04/22 11/19/21 01/03/22
Record Close 36,799.65 16,057.44 4,796.56
Week 17-Friday & Close(04/29/22) 32,977.21 12,334.64 4,131.93
Week 18-Monday(05/02/22) 33,061.50 12,536.02 4,155.38
    Day Change 84.29 201.38 23.45
    Day % Change 0.26% 1.63% 0.57%
Week 18-Tuesday(05/03/22) 33,128.79 12,563.76 4,175.48
    Day Change 67.29 27.74 20.10
    Day % Change 0.20% 0.22% 0.48%
Week 18-Wednesday(05/04/22) 34,061.06 12,964.86 4,300.17
    Day Change 932.27 401.10 124.69
    Day % Change 2.81% 3.19% 2.99%
Week 18-Thursday(05/05/22) 32,997.97 12,317.69 4,146.87
    Day Change (1,063.09) (647.17) (153.30)
    Day % Change -3.12% -4.99% -3.56%
Week 18-Friday & Close(05/06/22) 32,899.37 12,144.66 4,123.34
    Day Change (98.60) (173.03) (23.53)
    Day % Change -0.30% -1.40% -0.57%
Change-Week (77.84) (189.98) (8.59)
% Change-Week -0.24% -1.54% -0.21%
Change-Month-to-Date (77.84) (189.98) (8.59)
% Change-Month-to-Date -0.24% -1.54% -0.21%
Change-Quarter-to-Date (1,778.98) (2,075.86) (407.07)
% Change-Quarter-to-Date -5.13% -14.60% -8.99%
Change-Year-to-Date (3,438.93) (3,500.31) (642.84)
% Change-Year-to-Date -9.46% -22.37% -13.49%
Change-Record (3,900.28) (3,912.78) (673.22)
% Change-Record -10.60% -24.37% -14.04%

The Stock Market Bull and Bear Tallies 2022 YTD

Week 18 Winner and Tally  Bear 3-0 Win
April Winner and Tally Bear 3-0 Win
Weeks Months 2022 YTD
The Stock Market Bull 4 1
The Stock Market Bear 12 3 Winning
Mixed Result 2 0
  Totals 18 4

Influences/News:

  • The main news item for the week was the result of the US Federal Open Market Committee’s decision on Wednesday to hike the short term federal funds interest rate by 0.50% making the rate now at 0.75% to 1.00%. It also announced plans to phase in a selloff of its $9 trillion bonds stockpile starting in June 2022. It was also announced that they do not intend to do a 0.75% increase in an effort to control inflation. Finally, they indicated that they believe they can use their tools to have a soft economic landing and avoid a dreaded recession.
  • Russia continues to pound away at the eastern part of Ukraine, making slow progress.  Ukraine claims that they have retaken some of the eastern areas. The United Nations and humanitarian relief agencies were able to get an agreement to evacuate several civilian survivors  from the strategic port city of Mariupol who were holed up in the expansive Azovstal steel plant. Ukraine defenders refuse to surrender and vow to fight to the death as the over 2 months attack continues. The European Union is proposing a ban on Russian crude oil imports to be effective within 6 months. Poland raises $6.5 billion in humanitarian aid by hosting an international donor conference. US President Biden announces an additional $150 million in additional aid for a security package. The Ukrainian cabinet is putting together a postwar rebuilding plan as its president Zelenskyy appeals to Western allies to propose a post World War II type Marshall Plan.
  • N Korea launches another ballistic missile test, again creating concern about its ability to deliver nuclear weapons.
  • A rare leak of a US Supreme Court draft of a majority opinion that supports the overturn of the controversial Roe vs Wade abortion decision of 1972 results in rallies across the country by abortion-rights supporters. Chief Justice John Roberts orders an investigation and says the leak will not have an affect on the work of the Supreme Court. US Senate Democrats plan to force a procedural vote on a bill to codify abortion protections. A final bill is not expected to pass because it would require at least 60 votes, which is unlikely, and would also be subject to a Republican filibuster.
  • US 1Q22 corporate earnings of public companies continue to be released, results are mixed.

US Economic News:

  • The Dept of Commerce/Census says the Preliminary March 2022 Construction Spending-Residential is at $891.3 billion, Non-Residential $839.2 billion, for March 2022 Total Construction Spending at $1,730.5 billion, +0.1% from February 2022, +11.8% from March 2021.
  • The Institute for Supply Management(ISM) Preliminary April 2022 Manufacturing PMI Index is at 55.4%, March was at 57.1%, February 58.6%, April 2021 60.7%. “Panel sentiment remained strongly optimistic regarding demand, though the three positive growth comments for every cautious comment was down from March’s ratio of 6-to-1, Panelists continue to note supply chain and pricing issues as their biggest concerns.”
  • The S&P Global April 2022 US Manufacturing PMI Index is at 59.2, March was at 58.8, February 57.3, April 2021 60.5. “… while the survey data add to indications that the pace of economic growth will improve in the second quarter after a lacklustre first quarter, the less welcome news is that elevated inflationary pressures show no signs of relenting.”
  • The Dept of Labor says the Preliminary March 2022 US Job Openings-Private is at 10,504,000, Government 1,044,000, making March 2022 US Job Openings Total at 11,548,000, the highest level in the history of the series which began in December 2000,
    February was at 11,344,000, January 11,283,000, March 2021 8,480,000, March 2020 5,769,000.
  • The Dept of Commerce/Census says the Preliminary March 2022 Manufacturers New Orders-Durables is at $275.8 billion, Non-Durables $281.5, making March 2022 Manufacturers New Orders Total at $557.3 billion, February was at $545.5 billion, January $544.7, March 2021 $488.1 billion, March 2020 $402.7 billion.
  • The PurdueU/CME Group April 2022 Ag Economy Barometer Composite Index is at 121, March was at 113, February 125, April 2021 178, April 2020 96. “… despite this month’s improvement in sentiment, the index was still 32% lower than a year earlier indicating producers remain troubled regarding the uncertainty surrounding input prices and availability… Furthermore, it appears the war in Ukraine has exacerbated concerns among producers about input price levels and made availability even more uncertain.”
  • ADP says the Preliminary April 2022 Change in US Employment(Private Sector)-Small Sized Companies(1-49 employees) is at -120,000, Medium(50-499) +46,000, Large(500 or more) +321,000, for a Net Change of +247,000; the Goods Producing Sector is +46,000, Services Sector +202,000. “While hiring demand remains strong, labor supply shortages caused job gains to soften for both goods producers and services providers. As the labor market tightens, small companies, with fewer than 50 employees, struggle with competition for wages amid increased costs.”
  • The Dept of Commerce/Census says the Preliminary March 2022 US Exports-Goods is at $170.7 billion, Services $71.1 billion, making March 202s US Exports Total at $241.8 billion; the Preliminary March 2022 US Imports-Goods is at $298.8 billion, Services $52.7 billion, making March 2022 US Imports Total at $351.5 billion, making the March 2022 US International Trade Deficit at $109.7 billion, making the March 2022 YTD Deficit(3 months) at $288.7 billion, March 2021 was at $204.2 billion, March 2020 $134.3 billion.
  • The Institute for Supply Management April 2022 US Services PMI Index(>50% economy growing) is at 57.1%, March was at 58.3%, February 56.5%, April 2021 62.7%, April 2020 41.8%. “… Growth continues for the services sector, which has expanded for all but two of the last 147 months. There was a pullback in the composite index, mostly due to the restricted labor pool (impacting the Employment Index) and the slowing of new orders growth…”
  • The S&P Global April 2022 US Composite PMI Output Index is at 56.0, March was at 57.7, February 55.9, April 2021 63.5, April 2020 27.0. “… Enjoying strong demand, firms were increasingly able to pass on higher energy, materials and staff costs to customers, indicating an economy that continues to run hot.”
  • The Federal Open Market Committee releases a statement and has a press conference following its meeting of 05/03-04/22, increases the federal funds short term interest rates by 0.50% to 0.75% to 1.00%, plans to phase in a selloff of its $9 trillion bonds stockpile starting in June 2022.
  • The Dept of Labor says the Preliminary 1Q22 US Business Sector Labor Productivity Output/Hr Annual Rate(Table 1) is at -7.7%, 4Q21 was at +6.3%, 3Q21 -3.7%, 2Q21 +3.4%, 1Q21 +2.1%, 1Q20 -1.8%.
  • The Dept of Labor says the April 2022 US Available Labor Force is at 164,046,000, Employed is at 158,105,000, Unemployed 5,941,000, for an April 2022 Unemployment Rate of 3.6%, March was at 3.6%, February 3.8%, April 2021 6.1%, April 2020 14.7%, April 2019 3.6%.
  • The Federal Reserve says Preliminary 1Q22 Consumer Credit Outstanding-Revolving is at $1.098 trillion, Non-Revolving $3.442 trillion, making 1Q22 Consumer Credit Outstanding Total at $4.539 trillion, 4Q21 was at $4.432 trillion, 3Q21 $4.356 trillion, 1Q21 $4.229 trillion, 1Q20 $4.204 trillion, 1Q19 $4.044 trillion.


More Resources:

Check out the BLOG page for the previous RECAPS and SNAPSHOTS posts.

Click here to follow The PBR1000 on Twitter!

PBRMarketTools Info:

If you are not a current The PBR1000 or The PBR25 Subscriber go to the Subscribe page for more information and to get our latest research and monthly snapshots.

Please use the Contact Us page if you are not on our email list or have questions about The PBR1000The PBR25 Top Buy StocksThe PBRMarketTools US Economic Indices or the Customization Services we provide. We appreciate your comments and suggestions!

The PBR1000:

PBRMarketTools.com provides The PBR1000, a compilation of 1,000 of the largest publicly held companies with primary operations in the US. These companies generate $15 trillion in annual revenues, more than all other US companies combined. The PBR1000 Monthly Snapshots provides these 1,000 companies in Excel format, includes 15 worksheets with 28 rankings, over 200 data/information points, hotlinks to key data, and important news items per company.

Disclaimers: The research PBRMarketTools.com provides is compiled from a variety of publicly available resources. As such, PBRMarketTools.com is not responsible for the data itself. Any liability for the representations or decisions based on the data is solely the responsibility of the authorized user, not PBRMarketTools.com, its employees or affiliates. PBRMarketTools.com is an independent business intelligence service providing news, data, and analysis. We provide information only and it should not be regarded as recommendations or advice. PBRMarketTools.com is not a financial advisory or stock brokerage firm and has no affiliation with such organizations.

This business intelligence report is provided by: 

(Article image is courtesy of FreeDigitalPhotos.net, ddpavumba.)


Empowering Astute Business Leaders and Shrewd Investors
Through The PBR1000 Analytics!

Copyright © 2022 by Pax Business Resources, LLC, All Rights Reserved.

The Week 17 of 2022 US Stock Market News Recap

The Week 17 and Month of April 2022 US Stock Market News Recap

Stock Market Bull Bear Stocks Investing Investor ThePBR1000 ThePBR25

The Stock Market Bull was leading Week 17 of 2022 at the end of Thursday, but The Stock Market Bear wanted his 4 week win streak more.

By Larry C. Paxton

The US Stock Market Week 17 and April Summary:

The Stock Market Bear started off Week 17 of 2022 the same way he ended Week 16, by starting to inflict more pain on the major US stock indices. But The Stock Market Bull, filled with new energy, charged into the pasture towards the end of the day, the indices did a U turn, and The Stock Market Bull won Monday going away. The Stock Market Bear retaliated on Tuesday, and spilled a lot of blood to take the day. On Wednesday The Stock Market Bull managed to mostly neutralize The Stock Market Bear and took a slim 2-1 mixed win for the day. Encouraged, The Stock Market Bull returned on Thursday in a big way and closed with a lead for the week in all three major US stock indices. But on Friday The Stock Market Bear returned and angrily took no prisoners to get the Week 17 victory, his first string of 4 weekly wins in 2022, and all in March. The Stock Market Bear also easily gets the April 2022 victory in a dominant way after having lost March. Now we start a new month and wonder if The Stock Market Bull or Bear become enamored with and distracted by the May flowers.


US Stock Market Indices Summary

Week 17 and Month of April 2022 Ending 04/29/22

DJIA NASDAQ S&P500
Previous Year Close(12/31/21) 36,338.30 15,644.97 4,766.18
Previous Quarter Close(03/31/22) 34,678.35 14,220.52 4,530.41
Previous Month Close(03/31/22) 34,678.35 14,220.52 4,530.41
Record Close Date 01/04/22 11/19/21 01/03/22
Record Close 36,799.65 16,057.44 4,796.56
Week 16-Friday & Close(04/22/22) 33,811.40 12,839.29 4,271.78
Week 17-Monday(04/25/22) 34,049.46 13,004.85 4,296.12
    Day Change 238.06 165.56 24.34
    Day % Change 0.70% 1.29% 0.57%
Week 17-Tuesday(04/26/22) 33,240.18 12,490.74 4,175.20
    Day Change (809.28) (514.11) (120.92)
    Day % Change -2.38% -3.95% -2.81%
Week 17-Wednesday(04/27/22) 33,301.93 12,488.93 4,183.96
    Day Change 61.75 (1.81) 8.76
    Day % Change 0.19% -0.01% 0.21%
Week 17-Thursday(04/28/22) 33,916.39 12,871.53 4,287.50
    Day Change 614.46 382.60 103.54
    Day % Change 1.85% 3.06% 2.47%
Week 17-Friday & Close(04/29/22) 32,977.21 12,334.64 4,131.93
    Day Change (939.18) (536.89) (155.57)
    Day % Change -2.77% -4.17% -3.63%
Change-Week (834.19) (504.65) (139.85)
% Change-Week -2.47% -3.93% -3.27%
Change-Month-to-Date (1,701.14) (1,885.88) (398.48)
% Change-Month-to-Date -4.91% -13.26% -8.80%
Change-Quarter-to-Date (1,701.14) (1,885.88) (398.48)
% Change-Quarter-to-Date -4.91% -13.26% -8.80%
Change-Year-to-Date (3,361.09) (3,310.33) (634.25)
% Change-Year-to-Date -9.25% -21.16% -13.31%
Change-Record (3,822.44) (3,722.80) (664.63)
% Change-Record -10.39% -23.18% -13.86%

The Stock Market Bull and Bear Tallies 2022 YTD

Week 17 Winner and Tally  Bear 3-0 Win
April Winner and Tally Bear 3-0 Win
Weeks Months 2022 YTD
The Stock Market Bull 4 1
The Stock Market Bear 11 3 Winning
Mixed Result 2 0
  Totals 17 4

Influences/News:

  • Russia increases its attacks in the southeastern part of Ukraine in the Donbas and other areas, but Ukraine resistance is making progress slow with reports of significant casualties on both sides. Russia warns of the possible use of nuclear weapons as other countries start to supply more arms and support to Ukraine, including Poland giving Ukraine 240 Russian made tanks. US President Biden asks Congress to add $33 billion in aid for Ukraine’s defense. Russia launches some rockets into the capital city of Kyiv as the United Nations Secretary-General is visiting.
  • China continues to try to control COVID-19 outbreaks with lockdowns in Shanghai and perhaps soon Beijing as part of its zero-COVID campaign.
  • N Korea’s Supreme Leader Kim Jong-un says it is increasing in nuclear weapons capabilities as a deterrence to Western countries.
  • France’s President Emmanuel Macron of the LREM party wins his re-election bid to serve a 2nd 5 year term, wins over Marine Le Pen of the National Rally party with a 59% to 41% margin.
  • US corporate quarterly earnings reports are mixed.
  • US President Biden says he will be proposing a student loan forgiveness plan in a few weeks.

US Economic News:

  • The Federal Reserve Bank of Chicago Preliminary March 2022 US National Activity Index came in at +0.44, February was at +0.54, January +0.75, March 2021 +2.31. “Index points to a slight decrease in economic growth in March.”
  • The Dept of Commerce/HUD reported that Preliminary March 2022 New Family Home Sales Annual Rate is at 763,000 units, February was at 835,000, January 845,000, March 2021 873,000; the March 2022 New Home Median Price is at $436,700, February was at $421,600, January $431,100, March 2021 $359,600.
  • The S&P CoreLogic Case-Shiller Preliminary February 2022 US National Home Price Index(01/2000=100) is at 286.68, January was at 281.80, December 2021 278.52, February 2021 239.29, making for a 12 Month Change of +19.80%.
  • The Conference Board Preliminary April 2022 Consumer Confidence Index(1985=100) is at 107.3, March was at 107.6. “… purchasing intentions are down overall from recent levels as interest rates have begun rising. Meanwhile, concerns about inflation retreated from an all-time high in March but remained elevated. Looking ahead, inflation and the war in Ukraine will continue to pose downside risks to confidence and may further curb consumer spending this year.”
  • The Dept of Commerce/Census says the Preliminary 1Q22 Total Housing Units are at 142,711.000, +1,222.000 from 1Q21, Occupancy Rate is at 89.4%, Homeownership Rate 65.4%.
  • TrueCar forecasts April 2022 New Auto Sales-Retail to be 1,088,345 vehicles, Fleet at 159,572, for April 2022 Total New Auto Sales to be 1,247,917, April 2021 was at 1,512,158; April 2022 Average Transaction Price is at $43,755, April 2021 was at $38,163.
  • The Energy Information Administration says April 22, 2022, Crude Oil Stockpiles(Millions of Barrels) was at 414.4, March 25, 2022, was at 409.9, April 23, 2021, was at 493.1.
  • The Dept of Labor says for the Week Ending April 23, 2022, Weekly Initial Jobless Claims were at 180,000, March 26, 2022, was at 202,000, April 24, 2021, 553,000, April 25, 2020, 3,839,000.
  • FreddieMac says on April 28, 2022, 30 Year Fixed Rate Mortgages averaged 5.1% with 0.8 for points & fees, March 31, 2022, was at 4.67%, April 30, 2021, 2.98%, April 30, 2020, 3.23%. “The combination of swift home price growth and the fastest mortgage rate increase in over forty years is finally affecting purchase demand. Homebuyers navigating the current environment are coping in a variety of ways, including switching to adjustable-rate mortgages, moving away from expensive coastal cities, and looking to more affordable suburbs. We expect the decline in demand to soften home price growth to a more sustainable pace later this year.”
  • The Dept of Commerce/BEA says the Preliminary 1Q22 Annual Rate for the Quarter Gross Domestic Product(GDP) is at $24.383 trillion, 4Q21 was at $24.003 trillion, 1Q21 $22.038 trillion.
  • The Dept of Labor says the Preliminary 1Q22 Employment Cost Index for All Civilian Employees(12/2005=100) is at +150.1, 4Q21 was at +148.0, 1Q21 +143.7, 1Q20 +140.0.
  • The Dept of Commerce/BEA says the Preliminary March 2022 Personal Income Annual Rate is at $21.338 trillion, +0.5% from February, -2.4% from March 2021.
  • The American Automobile Assn says on April 29, 2022, the Average Price for a Gallon of Regular Gas is at $4.159, March 31 was at $4.225, February 28 $3.610, April 30, 2021 $2.895, April 30, 2020, $1.772.
  • The Dept of the Treasury says that on April 28, 2022, the US National Debt-Public is at $23.825 trillion, Intragovernmental $6.578 trillion, for US Total National Debt of $30.403, April 30, 2021, was at $28.175 trillion, April 30, 2020, $24.075 trillion.
  • Gold Per Ounce at the close on April 29, 2022, is at $1,911.70, on April 30, 2021, it was at $1,768.80, April 30, 2020, $1,694.20; Wheat Per Bushel closed on April 29, 2022, at 1,055.75 cents, April 30, 2021, it was at 734.75 cents, April 30, 2020, 517.25 cents; Oil Per Barrel closed on April 29, 2022, at $104.69, April 30, 2021, it was at $63.58, April 30, 2020, $18.84.
  • The Dept of the Treasury says at the close on April 29, 2022, the US 10 Year Treasury Note Yield is at 2.89%, April 30, 2021, was at 1.65%, April 30, 2020, 0.64%.
  • The Euro at the close on April 29, 2022, was at $1.0550, on April 30, 2021, it was at $1.2020, April 30, 2020, $1.0953; A Bitcoin at the close on April 29, 2022, was at $38,559, April 30, 2021, it was at $47,110, April 30, 2020, $6,169.
  • The U of Michigan Final April 2022 Consumer Sentiment Index is at 65.2, April 2021 was at 88.3, April 2020 71.8. “… The goal of a soft landing will be more difficult to achieve given the uncertainties that now prevail, raising prospects for a halt, or even a temporary reversal, in the Fed’s interest rate policies…”


More Resources:

Check out the BLOG page for the previous RECAPS and SNAPSHOTS posts.

Click here to follow The PBR1000 on Twitter!

PBRMarketTools Info:

If you are not a current The PBR1000 or The PBR25 Subscriber go to the Subscribe page for more information and to get our latest research and monthly snapshots.

Please use the Contact Us page if you are not on our email list or have questions about The PBR1000The PBR25 Top Buy StocksThe PBRMarketTools US Economic Indices or the Customization Services we provide. We appreciate your comments and suggestions!

The PBR1000:

PBRMarketTools.com provides The PBR1000, a compilation of 1,000 of the largest publicly held companies with primary operations in the US. These companies generate $15 trillion in annual revenues, more than all other US companies combined. The PBR1000 Monthly Snapshots provides these 1,000 companies in Excel format, includes 15 worksheets with 28 rankings, over 200 data/information points, hotlinks to key data, and important news items per company.

Disclaimers: The research PBRMarketTools.com provides is compiled from a variety of publicly available resources. As such, PBRMarketTools.com is not responsible for the data itself. Any liability for the representations or decisions based on the data is solely the responsibility of the authorized user, not PBRMarketTools.com, its employees or affiliates. PBRMarketTools.com is an independent business intelligence service providing news, data, and analysis. We provide information only and it should not be regarded as recommendations or advice. PBRMarketTools.com is not a financial advisory or stock brokerage firm and has no affiliation with such organizations.

This business intelligence report is provided by: 

(Article image is courtesy of FreeDigitalPhotos.net, ddpavumba.)


Empowering Astute Business Leaders and Shrewd Investors
Through The PBR1000 Analytics!

Copyright © 2022 by Pax Business Resources, LLC, All Rights Reserved.

The Week 11 of 2022 US Stock Market News Recap

The Week 11 of 2022 US Stock Market News Recap

Stock Market Bull Bear Investing Investor Stocks

In Week 11 of 2022 The Stock Market Bull takes over the pasture, gets 13 of 15 trading sessions, first outright win since Week 5.

By Larry C. Paxton

The US Stock Market Week 10 Summary:

With the continuing attacks on Ukraine by Russia, concerns about rising inflation, and news that another COVID-19 variant has shown up, The Stock Market Bear took two of the three major US stock indices on Monday. But The Stock Market Bull was tired of losing and with great determination charged into the pasture on Tuesday, chased The Stock Market Bear out, and forcefully kept The Stock Market Bear out the whole week. The Stock Market Bull gets a convincing 3-0 outright win in Week 11 of 2022, his first since Week 5, now also has a lead month-to-date for March. Will The Stock Market Bull‘s momentum carry over into Week 12? Welcome to the stock market’s version of March Madness!


US Stock Market Indices Summary

Week 11 of 2022 Ending 03/18/22

DJIA NASDAQ S&P500
Previous Year Close(12/31/21) 36,338.30 15,644.97 4,766.18
Previous Quarter Close(12/31/21) 36,338.30 15,644.97 4,766.18
Previous Month Close(02/28/22) 33,892.60 13,751.40 4,373.94
Record Close Date 01/04/22 11/19/21 01/03/22
Record Close 36,799.65 16,057.44 4,796.56
Week 10-Friday & Close(03/11/22) 32,944.19 12,843.81 4,204.31
Week 11-Monday(03/14/22) 32,945.24 12,581.22 4,173.11
    Day Change 1.05 (262.59) (31.20)
    Day % Change 0.00% -2.04% -0.74%
Week 11-Tuesday(03/15/22) 33,544.34 12,948.62 4,262.45
    Day Change 599.10 367.40 89.34
    Day % Change 1.82% 2.92% 2.14%
Week 11-Wednesday(03/16/22) 34,063.10 13,436.55 4,357.86
    Day Change 518.76 487.93 95.41
    Day % Change 1.55% 3.77% 2.24%
Week 11-Thursday(03/17/22) 34,480.76 13,614.78 4,411.67
    Day Change 417.66 178.23 53.81
    Day % Change 1.23% 1.33% 1.23%
Week 11-Friday & Close(03/18/22) 34,754.93 13,893.84 4,463.12
    Day Change 274.17 279.06 51.45
    Day % Change 0.80% 2.05% 1.17%
Change-Week 1,810.74 1,050.03 258.81
% Change-Week 5.50% 8.18% 6.16%
Change-Month-to-Date 862.33 142.44 89.18
% Change-Month-to-Date 2.54% 1.04% 2.04%
Change-Quarter-to-Date (1,583.37) (1,751.13) (303.06)
% Change-Quarter-to-Date -4.36% -11.19% -6.36%
Change-Year-to-Date (1,583.37) (1,751.13) (303.06)
% Change-Year-to-Date -4.36% -11.19% -6.36%
Change-Record (2,044.72) (2,163.60) (333.44)
% Change-Record -5.56% -13.47% -6.95%

The Stock Market Bull and Bear Tallies 2022 YTD

Week 11 Winner and Tally  Bull 3-0 Win
February Winner and Tally Bear 3-0 Win
Weeks Months 2022 YTD
The Stock Market Bull 3 0
The Stock Market Bear 7 2 Winning
Mixed Result 1 0
  Totals 11 2

Influences/News:

  • Russia continues its attacks on Ukraine in an increasingly questionable campaign. The Ukraine military continues to stymy much of Russia’s efforts, but artillery and cruise missiles appear to be intentionally aimed at inflicting damage on civilian populations and structures like hospitals and schools. According to the United Nations over 3.2 million Ukrainians have reached neighboring borders in search of safety. Negotiations between Ukraine and Russia are starting to show signs of a possible ceasefire. Ukraine President Volodymyr Zelenskyy makes an appeal to the US Congress for more aid. The US passes a spending bill bill that includes financial and military equipment assistance. Russian President Vladimir Putin justifies his actions in a large gathering at a stadium. US President Joe Biden tells Chinese President Xi Jinping that China’s apparent support of Russia might not be a wise decision and that there could be consequences. Sanctions against Russia and many of its oligarchs continue and appear to be starting to have an effect.
  • North Korea attempts another weapons test, which apparently failed.
  • Reinstatement of the 2015 Iranian nuclear deal makes some moves forward as much of the world seeks to replace Russian oil with alternate sources, including Iranian and Venezuelan oil. Iran also releases two high profile Iran-UK dual citizens after several years of detention is also sends a positive signal that a deal is possible.
  •  A new COVID-19 variant, the Omnicron BA.2, detected in the US two months ago, is starting to spread at a rapid rate, raising concerns that there might have to be some shutdowns again.
  • In US economic news this week the Producer Price Index grew at 0.8% in February, lower than forecast, and 10.0% over the past 12 months; the Federal Open Market Committee raises the federal funds rate a quarter percent to 0.25-0.50%, its first increase in four years, and the first of an expected many over the next couple of years in an effort to curb inflation while trying to prevent a recession; the Natl Home Builders Assn/Wells Fargo Housing Market Composite Index falls to 79, still reflecting a positive attitude towards homebuilding; February US Import Prices grew by 1.4%, 10.9% over the past 12 months, Exports grew 3.0%, 16.6% over the past 12 months; US Manufacturing Sales for January were at $1.785 trillion, +3.7% from December, +15.5% from 12 months ago; February Retail Sales were at $658.1 billion, +0.3% from January, +17.6% from February 2021; US New Residential Building Permits Issued for February are at a 1,859,000 annual rate, -1.9% from January, +7.7% from February 2021; US Factory Capacity for February was at 77.6%, January was at 77.3%, February 2021 72.7%; February US Existing Home Sales Annual Rate is at 6,020,000, -7.2% from January, -2.4% from February 2021; FreddieMac says the average 30 year fixed mortgage rate for the week rose to 4.16% +0.8 for fees & points; AAA says the average price for a gallon of gas in the US on 03/18/22 is at $4.274; the US Weekly Initial Jobless Insurance Claims for 03/12/22 was at 214,000, was 765,000 12 months earlier.

More Resources:

Check out the BLOG page for the previous RECAPS and SNAPSHOTS posts.

Click here to follow The PBR1000 on Twitter!

PBRMarketTools Info:

If you are not a current The PBR1000 or The PBR25 Subscriber go to the Subscribe page for more information and to get our latest research and monthly snapshots.

Please use the Contact Us page if you are not on our email list or have questions about The PBR1000The PBR25 Top Buy StocksThe PBRMarketTools US Economic Indices or the Customization Services we provide. We appreciate your comments and suggestions!

The PBR1000:

PBRMarketTools.com provides The PBR1000, a compilation of 1,000 of the largest publicly held companies with primary operations in the US. These companies generate $15 trillion in annual revenues, more than all other US companies combined. The PBR1000 Monthly Snapshots provides these 1,000 companies in Excel format, includes 15 worksheets with 28 rankings, over 200 data/information points, hotlinks to key data, and important news items per company.

Disclaimers: The research PBRMarketTools.com provides is compiled from a variety of publicly available resources. As such, PBRMarketTools.com is not responsible for the data itself. Any liability for the representations or decisions based on the data is solely the responsibility of the authorized user, not PBRMarketTools.com, its employees or affiliates. PBRMarketTools.com is an independent business intelligence service providing news, data, and analysis. We provide information only and it should not be regarded as recommendations or advice. PBRMarketTools.com is not a financial advisory or stock brokerage firm and has no affiliation with such organizations.

This business intelligence report is provided by: 

(Article image is courtesy of FreeDigitalPhotos.net, ddpavumba.)


Empowering Astute Business Leaders and Shrewd Investors
Through The PBR1000 Analytics!

Copyright © 2022 by Pax Business Resources, LLC, All Rights Reserved.

The Week 10 of 2022 US Stock Market News Recap

The Week 10 of 2022 US Stock Market News Recap

Stock Market Bull Bear Stocks Investing Recap

Week 10 is another weekly win for The Stock Market Bear as investors dwell on Russia’s continuing attack on Ukraine and inflation.

By Larry C. Paxton

The US Stock Market Week 10 Summary:

Like Russia’s continuing assault on Ukraine, The Stock Market Bear took his seventh week of 2022, Week 10, by inflicting major losses on Monday and Tuesday, was briefly interrupted by a successful counteroffensive by The Stock Market Bull on Wednesday, but then returned to make big gashes on the markets again on Thursday and Friday. With the Russia/Ukraine War intensifying, high inflation worries escalating, and the lingering effects of the COVID-19 pandemic, what will it take for The Stock Market Bull to prevent a trifecta of weekly losses in Week 11?


US Stock Market Indices Summary

Week 10 of 2022 Ending 03/11/22

DJIA NASDAQ S&P500
Previous Year Close(12/31/21) 36,338.30 15,644.97 4,766.18
Previous Quarter Close(12/31/21) 36,338.30 15,644.97 4,766.18
Previous Month Close(02/28/22) 33,892.60 13,751.40 4,373.94
Record Close Date 01/04/22 11/19/21 01/03/22
Record Close 36,799.65 16,057.44 4,796.56
Week 9-Friday & Close(03/04/22) 33,614.80 13,313.44 4,328.87
Week 10-Monday(03/07/22) 32,817.38 12,830.96 4,201.09
    Day Change (797.42) (482.48) (127.78)
    Day % Change -2.37% -3.62% -2.95%
Week 10-Tuesday(03/08/22) 32,632.64 12,795.55 4,170.70
    Day Change (184.74) (35.41) (30.39)
    Day % Change -0.56% -0.28% -0.72%
Week 10-Wednesday(03/09/22) 33,286.25 13,255.55 4,277.88
    Day Change 653.61 460.00 107.18
    Day % Change 2.00% 3.59% 2.57%
Week 10-Thursday(03/10/22) 33,174.07 13,129.96 4,259.52
    Day Change (112.18) (125.59) (18.36)
    Day % Change -0.34% -0.95% -0.43%
Week 10-Friday & Close(03/11/22) 32,944.19 12,843.81 4,204.31
    Day Change (229.88) (286.15) (55.21)
    Day % Change -0.69% -2.18% -1.30%
Change-Week (670.61) (469.63) (124.56)
% Change-Week -1.99% -3.53% -2.88%
Change-Month-to-Date (948.41) (907.59) (169.63)
% Change-Month-to-Date -2.80% -6.60% -3.88%
Change-Quarter-to-Date (3,394.11) (2,801.16) (561.87)
% Change-Quarter-to-Date -9.34% -17.90% -11.79%
Change-Year-to-Date (3,394.11) (2,801.16) (561.87)
% Change-Year-to-Date -9.34% -17.90% -11.79%
Change-Record (3,855.46) (3,213.63) (592.25)
% Change-Record -10.48% -20.01% -12.35%

The Stock Market Bull and Bear Tallies 2022 YTD

Week 10 Winner and Tally  Bear 3-0 Win
February Winner and Tally Bear 3-0 Win
Weeks Months 2022 YTD
The Stock Market Bull 2 0
The Stock Market Bear 7 2 Winning
Mixed Result 1 0
  Totals 10 2

Influences/News:

  • Russia’s attacks in Ukraine continue to be the major headlines. The world continues to watch anxiously as diplomatic efforts have failed so far. On the other hand, while Russia’s military offensive continues, it also seems somewhat vulnerable to the defenses and counterattacks by a determined, courageous, and brave Ukraine military and its volunteers. The Russians anticipated a 3 day war, and now it is in its 14th day. There has been a lot of destruction and human suffering, but there is no clear victory for Russian’s efforts to this point, even as the US, European Union and NATO offer moral support through economic sanctions but offering limited military support for Ukraine. What happens next can only be conjectures and based primarily on Russia’s actions, but the extremes range from Russia’s complete retreat to it defiantly unleashing its nuclear arsenal resulting in a civilization ending worldwide holocaust.
  • In other international news North Korea continues to test fire missiles, some of which appear to be capable of striking the US.
  • The Iran nuclear talks have been paused.
  • The COVID-19 pandemic has now claimed over 6 million lives worldwide and nearly 1 million in the US. However, rates of infections, hospitalizations, and deaths are dropping. There are concerns that there will be future variants, and that societies will have to develop strategies to deal with it forever, just like we have for the flu and other diseases.
  • In the US central Iowa experienced a series of killer tornados.
  • In some key US economic news consumer credit grew by 6.8% in January, the slowest pace in a year; wholesale trade was up 4.0% in January, +22.4% over the past 12 months; US international trade in January showed a deficit of $89.7 billion, the January 2021 deficit was at $65.2 billion; the consumer price index over the past 12 months, or the inflation rate, was +7.9%, highest in 40 years; the federal government spending deficit for February 2022 was at $217 billion, it was $311 billion in February 2021; the price for a gallon of gas is well above $4, with inflation and the Russia/Ukraine War contributing to that rise.
  • US Major League Baseball and the Players Union have agreed on terms, the 2022 season will be delayed by about a week, and all games will be played.
  • The Beijing 2022 Paralympics finish on March 13.

More Resources:

Check out the BLOG page for the previous RECAPS and SNAPSHOTS posts.

Click here to follow The PBR1000 on Twitter!

PBRMarketTools Info:

If you are not a current The PBR1000 or The PBR25 Subscriber go to the Subscribe page for more information and to get our latest research and monthly snapshots.

Please use the Contact Us page if you are not on our email list or have questions about The PBR1000The PBR25 Top Buy StocksThe PBRMarketTools US Economic Indices or the Customization Services we provide. We appreciate your comments and suggestions!

The PBR1000:

PBRMarketTools.com provides The PBR1000, a compilation of 1,000 of the largest publicly held companies with primary operations in the US. These companies generate $15 trillion in annual revenues, more than all other US companies combined. The PBR1000 Monthly Snapshots provides these 1,000 companies in Excel format, includes 15 worksheets with 28 rankings, over 200 data/information points, hotlinks to key data, and important news items per company.

Disclaimers: The research PBRMarketTools.com provides is compiled from a variety of publicly available resources. As such, PBRMarketTools.com is not responsible for the data itself. Any liability for the representations or decisions based on the data is solely the responsibility of the authorized user, not PBRMarketTools.com, its employees or affiliates. PBRMarketTools.com is an independent business intelligence service providing news, data, and analysis. We provide information only and it should not be regarded as recommendations or advice. PBRMarketTools.com is not a financial advisory or stock brokerage firm and has no affiliation with such organizations.

This business intelligence report is provided by: 

(Article image is courtesy of FreeDigitalPhotos.net, ddpavumba.)


Empowering Astute Business Leaders and Shrewd Investors
Through The PBR1000 Analytics!

Copyright © 2022 by Pax Business Resources, LLC, All Rights Reserved.

The PBR25 Top Buy Stocks Feb 2021 12 Month Report Card

The PBR25 Top Buy Stocks February 2021 12 Month Report Card

Report Card Stocks PBR1000 PBR25 Investing Investor

The PBR25 Top Buy Stocks 12 Month Report Card for February, 2021, gets an ‘D’ for falling short of its forecast and the three major US stock indices.

By Larry C. Paxton

Welcome to The February 2021 The PBR25 Top Buy Stocks 12 Month Report Card.

As investors we count on professional stock analysts to provide comprehensive and diligent research to come up with their best take on how stocks will perform over the next 12 months. We then use that information to help us make stock buy, hold and sell decisions.

The PBR25 Premise

The premise of The PBR25 is that there is a high probability of success for investing in stocks when a large enough number professional stock analysts through their extensive research determine that a stock is a “Buy” and also forecasts a significant return over the next 12 months. PBRMarketTools assigns a Report Card grade based on how the professional stock analysts did.

Last 12 Months Influences

It is difficult to forecast a result with much accuracy over a 12 month period. For example, the 12 month period ended with the invasion of Ukraine by Russia starting February 24, 2022, which no one predicted 12 months earlier. The COVID-19 pandemic also continued with new variants causing havoc throughout the 12 months, but numbers were dropping significantly towards the end of February 2022, with the total US death toll approaching one million over the two plus years of the pandemic. The effects created a lot of unemployment, affected many economic sectors like hospitality and travel services, closed schools, forced people to work from home, and much more. But there has also been a significant recovery as societies continue to try to regain a sense of “normalcy.” Inflation rates skyrocketed, but were expected to be transitory. However, the high levels have continued, and the US Federal Reserve is expected to start increasing short term interest rates. There also continues to be the aftermath of a very contentious 2020 US Presidential and general election process, which also created a lot of confusion and strife, with the major action being the attack on the US Capital Building on January 6, 2021. 12 months later The US House of Representatives continues to actively pursue investigations and convictions of people involved as the 2022 midterm elections come into play.  There are a lot more factors, but this is not meant to be an opinions post. It is a piece focused on the review of the recommendations stock analysts came up with at the end of February 2021 and the actual results 12 months later at the end of February 2022. PBRMarketTools is calling this a Report Card.

For this February 2021 Report Card we used stock data and forecasts from February 26, 2021, and compare it to the actual results on February 28, 2022.

Creating The PBR25 Top Buy Stocks List for February 2021

The starting point is the prestigious The PBR1000 US Public Companies, produced monthly by PBRMarketTools. To be included in The PBR1000 the 1,000 companies must meet the following criteria:

  • The companies must be publicly traded on the NYSE, NYSE American or NASDAQ stock exchanges, with a very few temporarily trading on the Over-The-Counter market because they are transitioning from bankruptcy.
  • They must be headquartered in the US or have primary operations in the US.
  • They must have generated at least $1 billion in revenues in their most recent full fiscal year.
  • They must file an annual 10-K form with the US Securities and Exchange Commission in US dollars
  • Each of the 1,000 companies is given a primary ranking based on revenues, with the company having the highest revenue amount ranked 1(currently Walmart). There are 27 secondary rankings in The PBR1000 based on other criteria as well.

Each month the 12 month estimates and recommendations by stock analysts are updated on The PBR1000The PBR25 Top Buy Stocks list for February 2021 was then created using the following process:

  • At any point in time The PBR1000 has around 15,000 stock analyst recommendations.
  • The PBR1000 is sorted several times to come up with The PBR25 Top Buy Stocks, made up of stocks that are rated a “Buy” by analysts, have a 12 Month Forecasted % Change of at least +20%, and have at least 10 “Buy” recommendations.

Actual Results for The PBR25 Top Buy Stocks for February 2021

  • No companies on the list were acquired or merged during the 12 month period.
  • In October, 2021, Facebook changed its name to Meta Platforms, but continues to use the stock trading symbol FB.
  • None of The PBR25 Top Buy Stocks for February 2021 did a stock split during the 12 months, so no data was altered for this report.

Following is a table of characteristics and 12 month actual results for the The PBR25 Top Buy Stocks on February 26, 2021, which we are calling the February 2021 report card.

The PBR25 Top Buy Stocks on 02/26/21

12 Month Report Card on 02/28/22

Total Companies 25
Low Weighted Avg 4.53
High Weighted Avg 5.00
Average Weighted Avg 4.68
Median Weighted Avg 4.67
Market Capitalization Low($B) 3.94
Market Capitalization High($B) 1,539.48
Average Market Capitalization($B) 126.49
Median Market Capitalization($B) 33.93
Total Market Capitalization($B) 3,162.31
Total NYSE Companies 17
Total NASDAQ Companies 8
12 Month 12 Month
Forecast for Actual
02/26/21 02/28/22 02/28/22
Low Stock Price-MTG 12.18 16.05 15.18
High Stock Price-AMZN 3,092.93 4,045.82 3,071.26
The PBR25 Total Stock Prices 6,664.50 8,664.13 6,879.28
Total Stock Price Change 1,999.63 214.78
Percent Change 30.00% 3.22%
DJIA Percent Change 9.57%
NASDAQ Percent Change 4.24%
S&P500 Change 14.77%
Lowest Actual Change-PTON 39.65% -75.88%
Highest Actual Change-PANW 25.19% 65.85%
Total Exceeding Forecast(Out of 25) 4
Total At or Exceeding 20% 8
Total with >0% Actual Return 20

Conclusions, Observations, Validations and Realities

  • If you had bought 1 share each of The PBR25 Top Buy Stocks at the closing price on February 26, 2021$6,664.50you would have achieved a +3.22% gain 12 months later at the close on February 28, 2022, $6,879.28, significantly less than the +30.00% estimate of  $8,664.13, historically a less than average 12 month return, much below the 12 month forecast, and below the returns on the DJIA, NASDAQ, and S&P500 indices. For this reason The February 2021 The PBR25 Top Buy Stocks gets an ‘D’ on its 12 month Report Card, only because it did have a small positive return.
  • It is difficult to forecast out 12 months with any great accuracy, there are just too many variables and uncertainties.
  • However, it does demonstrate that The PBR25 Top Buy Stocks is a valid methodology and process for that particular month.
  • Our demonstration account, called The Charlie Fund, uses the popular “Dollar Cost Averaging Investment Strategy” with the monthly The PBR25 Top Buy Stocks as the primary research tool. For the 12 Month Report Card period it achieved a greater than 30% return, a further validation of the methodology.
  • There are no guarantees! The reality is that there will always be ups and downs in the stock market and people make stocks buy, hold and sell decisions based on a wide range of  logical and emotional criteria, input from knowledgeable hard-working experts and well meaning friends, and if the sky is blue today. But the historical data is pretty convincing that stocks will trend up at an above average investment rate over the long haul.

Additional Information

  • The details of this summary, including company names and the over 200 fields of information for each company, were extracted from the updated The PBR25 Top Buy Stocks MS-Excel worksheet for February 2022, and has been distributed to The PBR25 Top Buy Stocks Subscribers for their personal use and further research
  • The next 12 Month Report Card will be for March 2021, and should be available early to mid April, 2022.
  • For characteristics of the most recent monthly The PBR25 Top Buy Stocks go to The PBR25 Top Buy Stocks information page.

The PBR25 Top Buy Stocks 12 Month Report Cards

Last 12 Months Summary

12 Month
Stock Price Stock Price 12 Month 12 Month
Report Card Month Forecast Date Actual Date Forecast Actual
March 2020 03/31/20 03/31/21 28.96% 53.35%
April 2020 05/01/20 04/30/21 16.16% 50.18%
May 2020 05/29/20 05/28/21 9.89% 37.80%
June 2020 07/02/20 07/02/21 30.88% 47.08%
July 2020 07/30/20 07/31/21 33.61% 37.77%
August 2020 09/01/20 08/31/21 32.85% 40.79%
September 2020 10/02/20 09/30/21 27.68% 52.82%
October 2020 10/30/20 10/29/21 26.43% 23.22%
October 2020 w/o AMZN 10/30/20 10/29/21 27.49% 35.49%
November 2020 11/30/20 11/30/21 21.41% 18.30%
November 2020 w/o AMZN 11/30/20 11/30/21 22.02% 27.45%
December 2020 12/31/20 12/31/21 19.19% 13.17%
December 2020 w/o AMZN 12/31/20 12/31/21 21.15% 25.22%
January 2021 01/29/21 01/31/22 27.04% 27.27%
February 2021 02/26/21 02/28/22 30.00% 3.22%
February 2021 w/o AMZN 02/26/21 02/28/22 29.31% 6.62%
   12 Month Average 25.34% 33.75%
   12 Mo Avg w/o AMZN 25.59% 36.82%

We are always interested in your feedback, which you can provide on the Contact Us page.

Not a The PBR25 Monthly Top Buy Stocks subscriber yet? Check out The PBR25 Information Page.

PBRMarketTools.com provides The PBR1000, a compilation of 1,000 of the largest publicly held companies with primary operations in the US. These companies generate $15 trillion in annual revenues, more than all other US companies combined. The PBR1000 Monthly Snapshots provides these 1,000 companies in Excel format, includes 15 worksheets with 28 rankings, over 200 data/information points, hotlinks to key data, and important news items per company. The monthly The PBR25 Top Buy Stocks is a subset of the monthly The PBR1000 and is available as a separate monthly or annual subscription.

Disclaimers: The PBR1000 is compiled from a variety of publicly available resources. As such, PBRMarketTools.com is not responsible for the data itself. Any liability for the representations or decisions based on the data is solely the responsibility of the authorized user, not PBRMarketTools.com, its employees or affiliates. PBRMarketTools.com is an independent business intelligence service providing news, data, and analysis. It is not a financial advisory or stock brokerage firm and has no affiliation with such organizations. Any research or opinions expressed should not be regarded as recommendations or advice.

Stocks PBR1000 PBR25 PBRMarketTools

(Article image courtesy of FreeDigitalPhotos.net)

Empowering Shrewd Investors Through The PBR1000 Analytics!

Copyright © 2022 by Pax Business Resources, LLC, All Rights Reserved. 

The Week 8 of 2022 US Stock Market News Recap

The Week 8 of 2022 US Stock Market News Recap

stock market bull bear stocks investing investor PBR1000

In a shortened Week 8 The Stock Market Bear claws out wins the first two days, The Stock Market Bull takes the last two days, and gets the Week 8 mixed 2-1 win.

By Larry C. Paxton

The US Stock Market Week 8 Summary:

Week 8 started with Monday a day off for the US stock exchanges to observe Presidents’ Day. But it was an anxious day as the world waited to see if Russia would invade Ukraine. On Tuesday and Wednesday The Stock Market Bear took charge by clawing his way to two very large losses days. Russia did attack Ukraine, sanctions were started against Russia, and The Stock Market Bull aggressively countered by taking charge on Thursday and Friday. At Friday’s close it was a split with The Stock Market Bull getting the 2-1 mixed win for the week and the first of 2022. Between the Russia-Ukraine concerns, inflation, and continuing COVID19 issues it was a fitting end to Week 8. Everyone is wondering, what will Week 9 bring?


US Stock Market Indices Summary

Week 8 of 2022 Ending 02/25/22

DJIA NASDAQ S&P500
Previous Year Close(12/31/21) 36,338.30 15,644.97 4,766.18
Previous Quarter Close(12/31/21) 36,338.30 15,644.97 4,766.18
Previous Month Close(01/31/22) 35,131.86 14,239.88 4,515.55
Record Close Date 01/04/22 11/19/21 01/03/22
Record Close 36,799.65 16,057.44 4,796.56
Week 7-Friday & Close(02/18/22) 34,079.18 13,548.07 4,348.87
Week 8-Monday(02/21/22) 34,079.18 13,548.07 4,348.87
    Day Change 0.00 0.00 0.00
    Day % Change 0.00% 0.00% 0.00%
Week 8-Tuesday(02/22/22) 33,596.61 13,381.52 4,304.76
    Day Change (482.57) (166.55) (44.11)
    Day % Change -1.42% -1.23% -1.01%
Week 8-Wednesday(02/23/22) 33,131.76 13,037.49 4,225.50
    Day Change (464.85) (344.03) (79.26)
    Day % Change -1.38% -2.57% -1.84%
Week 8-Thursday(02/24/22) 33,223.83 13,473.59 4,288.70
    Day Change 92.07 436.10 63.20
    Day % Change 0.28% 3.34% 1.50%
Week 8-Friday & Close(02/25/22) 34,058.75 13,694.62 4,384.65
    Day Change 834.92 221.03 95.95
    Day % Change 2.51% 1.64% 2.24%
Change-Week (20.43) 146.55 35.78
% Change-Week -0.06% 1.08% 0.82%
Change-Month-to-Date (1,073.11) (545.26) (130.90)
% Change-Month-to-Date -3.05% -3.83% -2.90%
Change-Quarter-to-Date (2,279.55) (1,950.35) (381.53)
% Change-Quarter-to-Date -6.27% -12.47% -8.00%
Change-Year-to-Date (2,279.55) (1,950.35) (381.53)
% Change-Year-to-Date -6.27% -12.47% -8.00%
Change-Record (2,740.90) (2,362.82) (411.91)
% Change-Record -7.45% -14.71% -8.59%

The Stock Market Bull and Bear Tallies 2022 YTD

Week 8 Winner and Tally  Bull 2-1 Mixed Win
January Winner and Tally Bear 3-0 Win
Weeks Months 2022 YTD
The Stock Market Bull 2 0
The Stock Market Bear 5 1 Winning
Mixed Result 1 0
  Totals 8 1

Influences/News:

  • The Russia-Ukraine concerns became reality as Russia initially launched offenses to take over two breakaway Ukraine regions, then started closing in on the major city of Kyiv by the end of the week. NATO had an emergency session, agreed to beef up troops in neighboring countries. Speeches by US President Biden and many other world leaders from democracies denounced the use of military force, pledged to impose economic sanctions against Russia and its political and corporate leaders. Ukraine President Zelensky encouraged its military and citizens to provide resistance with some apparent initial success.
  • Inflation in the US continues to be a big issue. The Federal Open Market Committee meets next month some members are talking about a quarter or half percent increase in the federal short term interest rate.
  • COVID19 and associated variants cases and hospitalizations are decreasing rapidly, the US Center for Disease Control indicated that it is considering making some recommendations about the use of masks, probably to be oriented more towards communities that the nation itself.
  • US President Biden nominates Ketanji Brown Jackson, a federal judge on the US Court of Appeals for the District of Columbia Circuit since 2021, to replace retiring US Supreme Court Justice Stephen Breyer. She is the first black female to be nominated for the position.
  • In US economic news the Case-Shiller housing report indicated that in December home prices had increased by 18.6% over 12 months. The US Gross Domestic Product annual rate for 21Q4 was revised from +6.9% to +7.0%. US weekly initial jobless claims dropped 17,000 to 232,000 last week, closing in on pre-pandemic numbers. US mortgage rates dropped a little to an average of 3.89% with 0.8 points & fees in the last week. US personal incomes were little changed from the previous month.

More Resources:

Check out the BLOG page for the previous RECAPS and SNAPSHOTS posts.

Click here to follow The PBR1000 on Twitter!

PBRMarketTools Info:

If you are not a current The PBR1000 or The PBR25 Subscriber go to the Subscribe page for more information and to get our latest research and monthly snapshots.

Please use the Contact Us page if you are not on our email list or have questions about The PBR1000The PBR25 Top Buy StocksThe PBRMarketTools US Economic Indices or the Customization Services we provide. We appreciate your comments and suggestions!

The PBR1000:

PBRMarketTools.com provides The PBR1000, a compilation of 1,000 of the largest publicly held companies with primary operations in the US. These companies generate $15 trillion in annual revenues, more than all other US companies combined. The PBR1000 Monthly Snapshots provides these 1,000 companies in Excel format, includes 15 worksheets with 28 rankings, over 200 data/information points, hotlinks to key data, and important news items per company.

Disclaimers: The research PBRMarketTools.com provides is compiled from a variety of publicly available resources. As such, PBRMarketTools.com is not responsible for the data itself. Any liability for the representations or decisions based on the data is solely the responsibility of the authorized user, not PBRMarketTools.com, its employees or affiliates. PBRMarketTools.com is an independent business intelligence service providing news, data, and analysis. We provide information only and it should not be regarded as recommendations or advice. PBRMarketTools.com is not a financial advisory or stock brokerage firm and has no affiliation with such organizations.

This business intelligence report is provided by: 

(Article image is courtesy of FreeDigitalPhotos.net, ddpavumba.)


Empowering Astute Business Leaders and Shrewd Investors
Through The PBR1000 Analytics!

Copyright © 2022 by Pax Business Resources, LLC, All Rights Reserved.

The Week 6 of 2022 US Stock Market News Recap

The Week 6 of 2022 US Stock Market News Recap

Stock Market Bull Bear Stocks Recap Investing ThePBR1000

The Stock Market Bear comes from behind in Week 6, gets the 3-0 win, and prevents The Stock Market Bull from achieving its first trifecta of wins in 2022.

By Larry C. Paxton

The US Stock Market Week 6 Summary:

In what has become a somewhat recurring theme for 2022, Week 6 started with a mixed result by small margins on Monday in favor of The Stock Market Bear. But on Tuesday and Wednesday The Stock Market Bull aggressively charged into the pasture and clearly dominated each day, creating a clear lead for the week. On Thursday The Stock Market Bear took his turn with a dominating result, but still behind for the week. To finish Week 6 The Stock Market Bear repeated his Thursday result, gets the 3-0 Week 6 result, and leaves The Stock Market Bull exhausted and unable to complete the three week trifecta of wins.

US Stock Market Indices Summary

Week 6 of 2022 Ending 02/11/22

DJIA NASDAQ S&P500
Previous Year Close(12/31/21) 36,338.30 15,644.97 4,766.18
Previous Quarter Close(12/31/21) 36,338.30 15,644.97 4,766.18
Previous Month Close(01/31/22) 35,131.86 14,239.88 4,515.55
Record Close Date 01/04/22 11/19/21 01/03/22
Record Close 36,799.65 16,057.44 4,796.56
Week 5-Friday & Close(02/04/22) 35,089.74 14,098.01 4,500.53
Week 6-Monday(02/07/22) 35,091.13 14,015.67 4,483.87
    Day Change 1.39 (82.34) (16.66)
    Day % Change 0.00% -0.58% -0.37%
Week 6-Tuesday(02/08/22) 35,462.78 14,194.45 4,521.54
    Day Change 371.65 178.78 37.67
    Day % Change 1.06% 1.28% 0.84%
Week 6-Wednesday(02/09/22) 35,768.06 14,490.37 4,587.18
    Day Change 305.28 295.92 65.64
    Day % Change 0.86% 2.08% 1.45%
Week 6-Thursday(02/10/22) 35,241.59 14,185.64 4,504.08
    Day Change (526.47) (304.73) (83.10)
    Day % Change -1.47% -2.10% -1.81%
Week 6-Friday & Close(02/11/22) 34,738.06 13,791.15 4,418.64
    Day Change (503.53) (394.49) (85.44)
    Day % Change -1.43% -2.78% -1.90%
Change-Week -351.68 -306.86 -81.89
% Change-Week -1.00% -2.18% -1.82%
Change-Month-to-Date (393.80) (448.73) (96.91)
% Change-Month-to-Date -1.12% -3.15% -2.15%
Change-Quarter-to-Date (1,600.24) (1,853.82) (347.54)
% Change-Quarter-to-Date -4.40% -11.85% -7.29%
Change-Year-to-Date (1,600.24) (1,853.82) (347.54)
% Change-Year-to-Date -4.40% -11.85% -7.29%
Change-Record (2,061.59) (2,266.29) (377.92)
% Change-Record -5.60% -14.11% -7.88%

The Stock Market Bull and Bear Tallies 2022 YTD

Week 6 Winner and Tally  Bear 3-0 Win
January Winner and Tally Bear 3-0 Win
Weeks Months 2022 YTD
The Stock Market Bull 2 0
The Stock Market Bear 4 1 Winning
Mixed Result 0 0
  Totals 6 1

Influences/News:

  • Russia continues to build up its armed forces along the Ukraine border, the US says it thinks an invasion is imminent, recommends that its around 30,000 citizens in Ukraine leave immediately, the US sends an additional 3,000 troops to Poland, and Russia continues to deny it is planning an attack.
  • The US Consumer Price Index is released on Thursday, indicates a surprisingly high 7.5% annual growth rate, raises concerns that the US Federal Reserve will up its funds rate more aggressively than originally expected, with possibly more rate increases during the year as well.
  • The US daily rate of new Omnicom COVID-19 variant cases starts to decline as predicted but death rates continue to remain high at over 2,000 per day.

More Resources:

Check out the BLOG page for the previous RECAPS and SNAPSHOTS posts.

Click here to follow The PBR1000 on Twitter!

PBRMarketTools Info:

If you are not a current The PBR1000 or The PBR25 Subscriber go to the Subscribe page for more information and to get our latest research and monthly snapshots.

Please use the Contact Us page if you are not on our email list or have questions about The PBR1000The PBR25 Top Buy StocksThe PBRMarketTools US Economic Indices or the Customization Services we provide. We appreciate your comments and suggestions!

The PBR1000:

PBRMarketTools.com provides The PBR1000, a compilation of 1,000 of the largest publicly held companies with primary operations in the US. These companies generate $15 trillion in annual revenues, more than all other US companies combined. The PBR1000 Monthly Snapshots provides these 1,000 companies in Excel format, includes 15 worksheets with 28 rankings, over 200 data/information points, hotlinks to key data, and important news items per company.

Disclaimers: The research PBRMarketTools.com provides is compiled from a variety of publicly available resources. As such, PBRMarketTools.com is not responsible for the data itself. Any liability for the representations or decisions based on the data is solely the responsibility of the authorized user, not PBRMarketTools.com, its employees or affiliates. PBRMarketTools.com is an independent business intelligence service providing news, data, and analysis. We provide information only and it should not be regarded as recommendations or advice. PBRMarketTools.com is not a financial advisory or stock brokerage firm and has no affiliation with such organizations.

This business intelligence report is provided by: 

(Article image is courtesy of FreeDigitalPhotos.net, ddpavumba.)


Empowering Astute Business Leaders and Shrewd Investors
Through The PBR1000 Analytics!

Copyright © 2022 by Pax Business Resources, LLC, All Rights Reserved.

The Week 5 of 2022 US Stock Market News Recap

The Week 5 of 2022 US Stock Market News Recap

Stock Market Bull Bear Investing Investor Stocks

In Week 5 of 2022 The Stock Market Bull gets a 3-0 outright win as he continues to fight back to regain his glory of 2021.

By Larry C. Paxton

The US Stock Market Week 5 Summary:

The Stock Market Bull, after his big last Friday and first weekly win, started out strong on Monday through Wednesday by taking all 9 sessions across the 3 major US stocks indices as economic news, particularly upcoming interest rate hikes, settled in and investors adjusted. But on Thursday The Stock Market Bear made a prominent appearance as Russia-Ukraine tensions increased significantly with the notice that the US was sending a few thousand troops to nearby countries and the COVID-19 pandemic continued to have elevated numbers. But on Friday The Stock Market Bull pushed The Stock Market Bear out of the pasture and had another nice day, thanks to the much better than expected employment numbers, and convincingly takes the 3-0 Week 5 win. The Stock Market Bull now has two weekly wins in a row, but he still has a way to go to catch up year-to-date. In Week 6 will he be able to match the trifecta of The Stock Market Bear who won the first three weeks of 2022?


US Stock Market Indices Summary

Week 5 of 2022 Ending 02/04/22

DJIA NASDAQ S&P500
Previous Year Close(12/31/21) 36,338.30 15,644.97 4,766.18
Previous Quarter Close(12/31/21) 36,338.30 15,644.97 4,766.18
Previous Month Close(01/31/22) 35,131.86 14,239.88 4,515.55
Record Close Date 01/04/22 11/19/21 01/03/22
Record Close 36,799.65 16,057.44 4,796.56
Week 4-Friday & Close(01/28/22) 34,725.47 13,770.57 4,431.85
Week 5-Monday(01/31/22) 35,131.86 14,239.88 4,515.55
    Day Change 406.39 469.31 83.70
    Day % Change 1.17% 3.41% 1.89%
Week 5-Tuesday(02/01/22) 35,405.24 14,346.00 4,546.54
    Day Change 273.38 106.12 30.99
    Day % Change 0.78% 0.75% 0.69%
Week 5-Wednesday(02/02/22) 35,629.33 14,417.55 4,589.38
    Day Change 224.09 71.55 42.84
    Day % Change 0.63% 0.50% 0.94%
Week 5-Thursday(02/03/22) 35,111.16 13,878.82 4,477.44
    Day Change (518.17) (538.73) (111.94)
    Day % Change -1.45% -3.74% -2.44%
Week 5-Friday & Close(02/04/22) 35,089.74 14,098.01 4,500.53
    Day Change (21.42) 219.19 23.09
    Day % Change -0.06% 1.58% 0.52%
Change-Week 364.27 327.44 68.68
% Change-Week 1.05% 2.38% 1.55%
Change-Month-to-Date (42.12) (141.87) (15.02)
% Change-Month-to-Date -0.12% -1.00% -0.33%
Change-Quarter-to-Date (1,248.56) (1,546.96) (265.65)
% Change-Quarter-to-Date -3.44% -9.89% -5.57%
Change-Year-to-Date (1,248.56) (1,546.96) (265.65)
% Change-Year-to-Date -3.44% -9.89% -5.57%
Change-Record (1,709.91) (1,959.43) (296.03)
% Change-Record -4.65% -12.20% -6.17%

The Stock Market Bull and Bear Tallies 2022 YTD

Week 5 Winner and Tally  Bull 3-0 Win
January Winner and Tally Bear 3-0 Win
Weeks Months 2022 YTD
The Stock Market Bull 2 0
The Stock Market Bear 3 1 Winning
Mixed Result 0 0
  Totals 5 1


More Resources:

Check out the BLOG page for the previous RECAPS and SNAPSHOTS posts.

Click here to follow The PBR1000 on Twitter!

PBRMarketTools Info:

If you are not a current The PBR1000 or The PBR25 Subscriber go to the Subscribe page for more information and to get our latest research and monthly snapshots.

Please use the Contact Us page if you are not on our email list or have questions about The PBR1000The PBR25 Top Buy StocksThe PBRMarketTools US Economic Indices or the Customization Services we provide. We appreciate your comments and suggestions!

The PBR1000:

PBRMarketTools.com provides The PBR1000, a compilation of 1,000 of the largest publicly held companies with primary operations in the US. These companies generate $15 trillion in annual revenues, more than all other US companies combined. The PBR1000 Monthly Snapshots provides these 1,000 companies in Excel format, includes 15 worksheets with 28 rankings, over 200 data/information points, hotlinks to key data, and important news items per company.

Disclaimers: The research PBRMarketTools.com provides is compiled from a variety of publicly available resources. As such, PBRMarketTools.com is not responsible for the data itself. Any liability for the representations or decisions based on the data is solely the responsibility of the authorized user, not PBRMarketTools.com, its employees or affiliates. PBRMarketTools.com is an independent business intelligence service providing news, data, and analysis. We provide information only and it should not be regarded as recommendations or advice. PBRMarketTools.com is not a financial advisory or stock brokerage firm and has no affiliation with such organizations.

This business intelligence report is provided by: 

(Article image is courtesy of FreeDigitalPhotos.net, ddpavumba.)


Empowering Astute Business Leaders and Shrewd Investors
Through The PBR1000 Analytics!

Copyright © 2022 by Pax Business Resources, LLC, All Rights Reserved.

The Week 52 of 2021 US Stock Market News Recap

The Week 52 of 2021 US Stock Market News Recap

Stock Market Bull Bear Stocks Investing

The Stock Market Bull only gets a 2-1 mixed win for Week 52, but he easily wins December and all of 2021 big time.

By Larry C. Paxton

The US Stock Market Week 52 Summary:

On Monday of Week 52, the last week of 2021, The Stock Market Bull had a big day in the pasture, a continuation of Week 51, taking all 3 major US stock indices, including a record close on the S&P500, without any resistance. On Tuesday he took the DJIA, but The Stock Market Bear wasn’t going away for the week as he took both the NASDAQ and S&P500 by small margins. The Stock Market Bull came back on Wednesday to establish new record closes on the DJIA and S&P500, but The Stock Market Bear was still ripping away at the NASDAQ. While The Stock Market Bull was preparing for his Happy New Year celebration he let The Stock Market Bear take Thursday and Friday by slim margins, resulting in the inadvertent loss of the NASDAQ for the week. The Stock Market Bull gets a mixed 2-1 win in Week 52 but needs to be congratulated for being the clear victor with an outstanding 2021. Of course, now the stage is set for 2022, expectations are all over the place as the pundits make their projections and predictions. Happy New Year to all!


US Stock Market Indices Summary

Week 52 of 2021 Ending 12/31/21

DJIA NASDAQ S&P500
Previous Year Close(12/31/20) 30,606.48 12,888.28 3,756.07
Previous Quarter Close(09/30/21 33,843.92 14,448.58 4,307.54
Previous Month Close(11/30/21) 34,483.72 15,537.69 4,567.00
Record Close Date 12/29/21 11/19/21 12/29/21
Record Close 36,488.63 16,057.44 4,793.06
Week 51-Friday & Close(12/24/21, Holiday) 35,950.56 15,653.37 4,725.79
Week 52-Monday(12/27/21) 36,302.38 15,871.26 4,791.19
    Day Change 351.82 217.89 65.40
    Day % Change 0.98% 1.39% 1.38%
Week 52-Tuesday(12/28/21) 36,398.21 15,781.72 4,786.35
    Day Change 95.83 (89.54) (4.84)
    Day % Change 0.26% -0.56% -0.10%
Week 52-Wednesday(12/29/21) 36,488.63 15,766.22 4,793.06
    Day Change 90.42 (15.50) 6.71
    Day % Change 0.25% -0.10% 0.14%
Week 52-Thursday(12/30/21) 36,398.08 15,741.56 4,778.73
    Day Change (90.55) (24.66) (14.33)
    Day % Change -0.25% -0.16% -0.30%
Week 52-Friday & Close(12/31/21) 36,338.30 15,644.97 4,766.18
    Day Change (59.78) (96.59) (12.55)
    Day % Change -0.16% -0.61% -0.26%
Change-Week 387.74 -8.40 40.39
% Change-Week 1.08% -0.05% 0.85%
Change-Month-to-Date 1,854.58 107.28 199.18
% Change-Month-to-Date 5.38% 0.69% 4.36%
Change-Quarter-to-Date 2,494.38 1,196.39 458.64
% Change-Quarter-to-Date 7.37% 8.28% 10.65%
Change-Year-to-Date 5,731.82 2,756.69 1,010.11
% Change-Year-to-Date 18.73% 21.39% 26.89%
Change-Record (150.33) (412.47) (26.88)
% Change-Record -0.41% -2.57% -0.56%

The Stock Market Bull and Bear Tallies 2021 YTD

Week 52 Winner and Tally  Bull 2-1 Mixed Win
December Winner and Tally Bull 3-0 Win
Weeks Months 2021
The Stock Market Bull 24 7 Won
The Stock Market Bear 18 1 Lost
Mixed Result 10 4
  Totals 52 12

Summary News Items for Week 52:

US Economic News

  • Friday, December 31, 2021

  • The US Dept of the Treasury says on 12/31/21 the US National Debt-Public is at $23.915 trillion, Intragovernmental $6.459 trillion, making the US National Debt Total at $29.474 trillion, 11/30/21 was at $28.908 trillion, 10/29/31 $28.909 trillion, 12/31/20 $27.747, 12/31/19 $23.201 trillion.
  • The US Dept of the Treasury says on 12/31/21 the US 10 Year Treasury Note Yield is at 1.52%, 11/30/21 was at 1.43%, 10/29/21 1.55%, 12/31/20 0.93%, 12/31/19 1.92%.
  • On 12/31/21 the Settlement Price for an Ounce of Gold is at $1,828.60, 11/30/21 was at $1,776.50, 10/29/21 $1,784.40, 12/31/20 $1,895.10, 12/31/19 $1,520.00.
  • At the close on 12/31/21 the US Price for a Euro is at $1.1373, 11/30/21 was at $1.1341, 10/29/21 $1.1560, 12/31/20 $1.2216, 12/31/19 $1.1203.
  • The American Automobile Assn says on 12/31/21 the US Average Price for a Gallon of Regular Gas is at $3.285, 11/30/21 was at $3.390, 10/29/21 $3.401, 12/31/20 $2.253, 12/31/19 $2.583.
  • Thursday, December 30, 2021

  • The US Dept of Labor says for the Week Ending 12/25/21 the US Preliminary Weekly Initial Jobless Claims is at 198,000, 11/20/21 was at 199,000, 10/23/21 281,000, 12/26/20 787,000, 12/21/19 222,000.
  • The US Dept of Commerce/BEA says the Preliminary 3Q21 US Net International Investment Position-Assets is at $34.455 trillion, Liabilities $50.526 trillion, making the 3Q21 US Net International Investment Position Deficit at $16.071 trillion, 2Q21 was at $15.906, 1Q21 $14.301 trillion, 3Q20 $13.767 trillion, 3Q19 $10.935 trillion. “The –$165.1 billion change in the net investment position from the second quarter to the third quarter came from net financial transactions of –$114.0 billion and net other changes in position, such as price and exchange-rate changes, of –$51.1 billion that mostly reflected the depreciation of major foreign currencies against the U.S. dollar that lowered the value of U.S. assets in dollar terms.”
  • FreddieMac says on 12/30/21 the US Weekly 30 Year Fixed Rate Home Mortgage Average is at 3.11% with 0.7 points & fees, 11/24/21 was at 3.10%, 10/28/21 3.14%, 12/31/20 2.67%, 12/26/19 3.74%. “Mortgage rates have effectively been moving sideways despite the increase in new COVID cases. This is because incoming economic data suggests that the economy remains on firm ground, particularly cyclical industries like manufacturing and housing. Moreover, low interest rates and high asset valuations continue to drive consumer spending. While we do expect rates to rise, the push of the first-time homebuyer demographic that’s been propelling the purchase market will continue in 2022 and beyond.”
  • MNI Indicators says the December 2021 Chicago Business Barometer(>50 Economy is gaining) is at 63.1, November was at 61.8, October 68.4, December 2020 58.7, December 2019 48.9.
  • Wednesday, December 29, 2021

  • The US Energy Information Administration says that on 12/24/21 US Crude Oil Inventories-Millions of Barrels is at 420.0, 11/19/21 was at 434.0, 10/22/21 430.8, 12/25/20 493.5, 12/20/19 441.4.
  • Tuesday, December 28, 2021

  • The S&P CoreLogic Case-Shiller Preliminary October 2021 US National Home Price Index(01/2000=100) is at 273.76, +19.1% from October 2020, September was at 271.49, August 268.89, October 2020 229.90, October 2019 212.10.
  • The US Federal Reserve Bank of Richmond says the Preliminary December 2021 US 5th District Manufacturing Index(Annualized) is at +16%, November was at +12%, October was also at +12%, December 2020 +19%, December 2019 -5%.
  • The US Federal Reserve Bank of Richmond says the Preliminary December 2021 US 5th District Service Sector Revenues Index(Annualized) is at +12%, November was at +12%, October +9%, December 2020 -9%, December 2019 +17%.
  • Monday, December 27, 2021

  • ***No economic news items scheduled.

US Government/Other News

  • US President Biden and Russian President Putin have a telephone conversation on Wednesday to discuss Ukraine. Biden pushes for de-escalation of Russian military forces on the border, threatens severe sanctions if Russia attacks Ukraine. Putin warns of a complete rupture in relations if sanctions proceed.
  • Airlines continue to struggle with COVID and staff shortage issues, cancel thousands of flights over the holidays.
  • The Omnicron COVID19 variant cases increase worldwide, reach a new daily record in the US with nearly 500,000 positive tests on Wednesday. The CDC recommends avoiding cruises because of outbreaks across several cruise lines.
  • Wildfires near Denver, Colorado, destroy hundreds of homes and businesses, leave thousands stranded.
  • Notable deaths this week: Harry Reid, 82former US Senator representing Nevada, and US Senate Majority Leader from 2007 to 2017; John Madden, 85, head football coach of the Oakland Raiders for 10 years and winning coach in Super Bowl XI, who then became a popular football sportscaster who also had a widely used video game named after him; Betty White, 99, an American actress over eight decades who became a beloved pioneer TV sitcom comedienne.

More Resources:

Check out the BLOG page for the previous RECAPS and SNAPSHOTS posts.

Click here to follow The PBR1000 on Twitter!

PBRMarketTools Info:

If you are not a current The PBR1000 or The PBR25 Subscriber go to the Subscribe page for more information and to get our latest research and monthly snapshots.

Please use the Contact Us page if you are not on our email list or have questions about The PBR1000The PBR25 Top Buy StocksThe PBRMarketTools US Economic Indices or the Customization Services we provide. We appreciate your comments and suggestions!

The PBR1000:

PBRMarketTools.com provides The PBR1000, a compilation of 1,000 of the largest publicly held companies with primary operations in the US. These companies generate $15 trillion in annual revenues, more than all other US companies combined. The PBR1000 Monthly Snapshots provides these 1,000 companies in Excel format, includes 15 worksheets with 28 rankings, over 200 data/information points, hotlinks to key data, and important news items per company.

Disclaimers: The research PBRMarketTools.com provides is compiled from a variety of publicly available resources. As such, PBRMarketTools.com is not responsible for the data itself. Any liability for the representations or decisions based on the data is solely the responsibility of the authorized user, not PBRMarketTools.com, its employees or affiliates. PBRMarketTools.com is an independent business intelligence service providing news, data, and analysis. We provide information only and it should not be regarded as recommendations or advice. PBRMarketTools.com is not a financial advisory or stock brokerage firm and has no affiliation with such organizations.

This business intelligence report is provided by: 

(Article image is courtesy of FreeDigitalPhotos.net, ddpavumba.)


Empowering Astute Business Leaders and Shrewd Investors
Through The PBR1000 Analytics!

Copyright © 2021 by Pax Business Resources, LLC, All Rights Reserved.

The PBR1000 November 2021 Top 5 Stocks Snapshots

The PBR1000 November 2021 Top 5 Stocks Snapshots

The Stock Market Bear Gets a Mixed Win

stocks stockmarket bull bear PBR1000

On the last day of November The Stock Market Bear overwhelmed The Stock Market Bull, but still ended up with only a 2-1 mixed win.

By Larry C. Paxton

US Stock Market Indices Summary

The Month of November 2021 Ending 11/30/21

DJIA NASDAQ S&P500
2020 Close(12/31/20) 30,606.48 12,888.28 3,756.07
3Q21 Close(09/30/21) 33,843.92 14,448.58 4,307.54
October 2021 Close(10/29/21) 35,819.56 15,498.39 4,605.38
Record Close Date 11/08/21 11/19/21 11/18/21
Record Close 36,432.22 16,057.44 4,704.54
November 2021 Close(11/30/21) 34,483.72 15,537.69 4,567.00
Percent Change-Month -3.73% 0.25% -0.83%
Percent Change-4Q21-to-Date 1.89% 7.54% 6.02%
Percent Change-Year-to-Date 12.67% 20.56% 21.59%
Percent Change-Record -5.35% -3.24% -2.92%

The Stock Market Bull and Bear Tallies YTD

Week 47 Winner and Tally  Bear 3-0 Win
November Winner and Tally Bear 2-1 Mixed Win
Weeks Months YTD
The Stock Market Bull 22 6 Winning
The Stock Market Bear 16 1 Losing
Mixed Result 9 4
  Totals 47 11

The US Stock Market November 2021 Summary:

Week 44, the first week in November, was all about The Stock Market Bull where out of 15 trading sessions across the three major US stock indices he closed with records in 14 of those sessions, a remarkable accomplishment. But like the gravitational law of physics that says what goes up must come down, The Stock Market Bear returned the favor in Week 45, but only needed 7 of the 15 sessions to take the week. In Week 46 The Stock Market Bear took the DJIA, The Stock Market Bull dominated in the NASDAQ closing with records, and they split the S&P500, but that included a record near the close of the week, with the result being a 2-1 mixed win for The Stock Market Bull. For Week 47, a basically 3 days and a half day trading week due to the US Thanksgiving holiday, The Stock Market Bear had a strong close on Black Friday, famous as the first shopping day of the Christmas season, as a gift from COVID-19, as the fast spreading Omnicore variant became the headline news. This continued into the last two days in November in Week 48. So, The Stock Market Bull’s strong start at the beginning of November was overtaken by The Stock Market Bear at the end of the month, but produced only a 2-1 monthly mixed win because The Stock Market Bull was able to hold onto his NASDAQ gains by the slimmest of margins.

Number of Trading Days: 21

Number of Gain(+)/Loss(-) Days: DJIA 10+/11-; NASDAQ 13+/8-; SPX 13+/8-.

Record Days: DJIA 5, NASDAQ 8, SPX 7, Total 20

Longest Gain Streak(Consecutive Days): DJIA 5 days(10/28-11/03/21)NASDAQ 11 days(10/25-11/08/21), and SPX 8 days(10/28-11/08/21)

Longest Loss Streak(Consecutive Days): DJIA 3 days(11/09-11/21, 11/17-19/21)NASDAQ 2 days(11/09-10/21, 11/22-23/21), and SPX 2 days(11/09-10/21, 11/19-22/21)

Big Swing Up Days(>1.00%): 3 days(4 sessions), 11/03/21( N +1.04%), 11/12/21(N +1.00%), 11/29/21(N +1.88%, S +1.32%)

Big Swing Down Days(<-1.00%): 4 days(8 sessions), 11/10/21(N -1.66%), 11/22/21(N -1.26%), 11/26/21(D -2.53%, N -2.23%, S -2.27%), 11/30/21(D -1.86%, N -1.55%, S -1.90%)

The PBR1000 November 2021 Top 5 Stocks Snapshots

The following are Top 5 partial tables excerpts from The PBR1000 November 2021 Snapshots. The price for stocks is for the close of trading on November 30, 20211 Month % Chg is compared to October 29, 202112 Months % Chg is compared to November 30, 2020, the 24 Months % Chg is compared to November 29, 2019, and 60 Months % Chg is compared to November 30, 2016. The PBR Rank is by last fiscal year annual revenues.

To get the complete The PBR1000 Snapshots  just click here to get your 12 month subscription and automatically download the November 2021 edition with the complete 15 Snapshots and 28 rankings with the bonuses The PBRMarketTools US Monthly Indices Snapshots and The PBR25 Top Buy Stocks.


Table 1(S11): The PBR1000 Top 5 Month Stock Price % Gainers

Table 1 Summary: The range was +65% to -52%319 out of 1,000 stocks were up 0% or more. The average was a loss of 2.14%, the median was a loss of 3.21%. The DJIA was -3.73%, NASDAQ +0.25%, SPX -0.83%.

Company PBR
Rank
Symbol Price
11/30/21
Mo
% Chg
12 Mos
% Chg
24 Mos
% Chg
60 Mos
% Chg
RR Donnelly 529 RRD $ 10.56 +65 +654 +166 -39
Avis Budget 486 CAR $ 274.59 +58 +681 +823 +617
Yellow Corp 557 YELL $ 13.16 +50 +119 +277 +4
BlueLinx 695 BXC $ 70.54 +48 +170 +587 +804
Coca-Cola Bottling 511 COKE $ 570.57 +42 +118 +111 n/a


Table 2(S12): The PBR1000 Top 5 12 Months Stock Price % Gainers

Table 2 Summary: The range was +2,032% to -53%912 out of 983 stocks were up 0% or more. The average was a gain of 42.14%, the median was a gain of 44.99%. The DJIA was +35.16%, NASDAQ +42.04%, SPX +40.84%.

Company PBR
Rank
Symbol Price
11/30/21
Mo
% Chg
12 Mos
% Chg
24 Mos
% Chg
60 Mos
% Chg
GameStop 506 GME $ 196.21 +7 +1,085 +2,995 +695
AMC Entertainment 981 AMC $ 33.94 -4 +695 +315 -0
Avis Budget 486 CAR $274.59 +58 +681 +823 +617
RR Donnelly 529 RRD $ 10.56 +65 +654 +166 -39
Peabody Energy 734 BTU $ 9.94 -16 +636 +3 n/a


Table 3(S13): The PBR1000 Top 5 24 Months Stock Price % Gainers

Table 3 Summary: The range was +2,995% to -79%704 out of 972 stocks were up 0% or more. The average was a gain of 41.97%. The median was a gain of 23.48%. The DJIA was +22.93%, NASDAQ +79.31%, SPX +45.40%.


Company PBR
Rank
Symbol Price
11/30/21
Mo
% Chg
12 Mos
% Chg
24 Mos
% Chg
60 Mos
% Chg
GameStop 506 GME $ 196.21 +7 +1,085 +2,995 +663
Tesla Motors 95 TSLA $ 1,144.76 +3 +102 +1,635 +2,922
Overstock 775 OSTK $ 89.26 -6 +32 +1,105 +439
Avis Budget 486 CAR $ 274.59 +58 +681 +823 +617
Antero Resources 652 AR $ 17.56 -12 +348 +782 -28


Table 4(R21): The PBR1000 Top 5 60 Months Stock Price % Gainers

Table 4 Summary: The range was +2,922% to -92%667 out of 917 stocks were up 0% or more. The average was a gain of 99.44%. The median was a gain of 46.32%. The DJIA was +80.32%, NASDAQ +191.86%, SPX +107.70%.


Company PBR
Rank
Symbol Price
11/30/21
Mo
% Chg
12 Mos
% Chg
24 Mos
% Chg
60 Mos
% Chg
Tesla Motors 95 TSLA $ 1,144.76 +3 +102 +1,635 +2,922
Crocs 963 CROX $ 164.02 +2 +179 +370 +2,243
Etsy 921 ETSY $ 274.58 +10 +71 +533 +2,114
AMD 298 AMD $ 158.37 +32 +71 +305 +1,677
RH 736 RH $ 583.18 -12 +29 +184 +1,518


Table 5(S15): The PBR1000 Top 5 Market Capitalization

Table 5 Summary: The range was $2,711 billion to $0.24 billion. The average is $44.183 billionmedian is $11.526 billion, out of 1,000 companies.

Company PBR
Rank
Symbol Market Cap($B)
11/30/21
1 Mo
% Chg
12 Mos
% Chg
24 Mos
% Chg
Apple 3 AAPL $ 2,712 +10 +37 +128
Microsoft 13 MSFT $2,482 -0 +53 +114
Alphabet 10 GOOG $ 1,936 -0 +60 +114
Amazon 2 AMZN $ 1,779 +4 +11 +97
Tesla Motors 95 TSLA $ 1,150 +4 +107 +1,825
The PBR1000
  $ 44,183.01 -1 +25 +49


Table 6: The PBR1000 Index & Primary US Stock Exchanges/Commodities


Company Price
11/30/21
1 Mo
% Chg
12 Mos
% Chg
24 Mos
% Chg
60 Mos
% Chg
The PBR1000 134,990.12 -2.1 +25.2 +42.0 +99.4
DJIA 34,483.72 -3.7 +16.4 +22.9 +80.3
NASDAQ 15,537.69 +0.3 +27.4 +79.3 +191.6
S&P500 4,567.00 -0.8 +26.1 +45.4 +107.7
GOLD 1,776.50 -0.4 -0.3 +20.6 +51.3
OIL 66.18 -20.51 +46.0 +20.0 +33.9
SOYBEANS(Cents) 1,217.25 -2.6 +4.2 +38.8 +17.9
BITCOIN(US$) 57,368.00 -8.0 +333.2 +774.7 +8,361.4


If you are not a current The PBR1000 or The PBR25 Subscriber go to the Subscribe page to get our latest research and monthly snapshots.

Please use the Contact Us page if you are a The PBR1000 company and would like to increase your visibility to our worldwide base of shrewd institutional an retail investors.

PBRMarketTools.com provides The PBR1000, a compilation of 1,000 of the largest publicly held companies with primary operations in the US. These companies generate $15 trillion in annual revenues, more than all other US companies combined. The PBR1000 Monthly Snapshots provides these 1,000 companies in Excel format, includes 15 worksheets with 28 rankings, over 200 data/information points, hotlinks to key data, and important news items per company.

Disclaimers: The PBR1000 is compiled from a variety of publicly available resources. As such, PBRMarketTools.com is not responsible for the data itself. Any liability for the representations or decisions based on the data is solely the responsibility of the authorized user, not PBRMarketTools.com, its employees or affiliates. PBRMarketTools.com is an independent business intelligence service providing news, data, and analysis. PBRMarketTools.com provides research only which should not be regarded as recommendations or advice. PBRMarketTools.com is not a financial advisory or stock brokerage firm and has no affiliation with such organizations.

This The PBR1000 business intelligence report is provided by: 

(Top graphic courtesy of FreeDigitalPhotos.com, ddpavumba.)

Empowering Astute Business Leaders and Shrewd Investors

Through The PBR1000 Analytics!

Copyright © 2021 by Pax Business Resources, LLC, All Rights Reserved.